Listening to a right whale
One moan, recorded in the Gulf of St Lawrence by a sonobuoy dropped from an aircraft
This post starts a series on what we can learn from a few hours of underwater sound from the Gulf of St Lawrence.
I first came across this dataset as one of the challenges at a UK Acoustics Network data challenge workshop. I was a novice at underwater acoustics and really enjoyed exploring it. I was so proud of pulling a right whale’s “moan” out of the noise and hearing it clearly. I’ve now revisited the dataset to see what else I can get out of it.
On the afternoon of 30 July 2018 a North Atlantic right whale in the southern Gulf of St Lawrence made the sound below. Press play and listen.
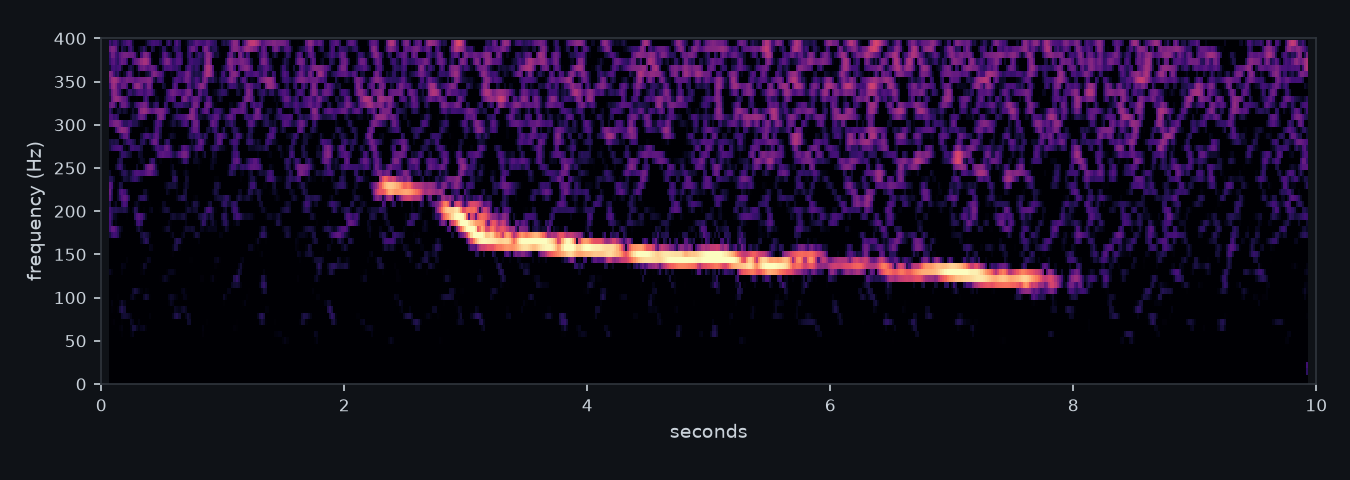
What you are looking at
The picture is a spectrogram. Time runs from left to right and pitch (frequency) from bottom to top. The brighter a spot, the more sound there is. A whistle would show up as a thin horizontal line and a click as a thin vertical one. The faint speckle everywhere is background noise from the sea, from ships and from the sonobuoy itself.1
The bright line is the whale. It starts high, drops quickly, then slides slowly down for about five and a half seconds.2
The analysts who annotated the dataset labelled it a moan. Their other right whale labels are upcall, gunshot and scream.3 Although described as a moan, no one is quite sure what this particular right whale was complaining about. If you are interested, Matthews and Parks (2021) give an overview of right whale acoustic behaviour, and Parks and Tyack (2005) describe the calls made in social groups at the surface.
Why “one octave up”?
Going up an octave means doubling the frequency. The simplest way to do that with a recording is to play it twice as fast. The moan moves up to about 240–460 Hz and now lasts under three seconds. Choose as recorded to hear it at its real pitch.
The whale’s moan is within the range of human hearing, but low sounds are hard to hear on laptop and phone speakers. Researchers often speed whale recordings up to help hear them, and Woods Hole’s page of whale sounds plays the same calls at several speeds. Turning data into sound like this is called audification.
The denoised version
Tick denoised to hear the moan on its own. This gets rid of the noise, which contains about 86% of the clip’s energy, leaving the gorgeous moan all on its own.
The noise is removed in the spectrogram itself. Effectively, I put my thumb over the whale sounds, paint over the noise and then remove my thumb. This is quite a quick and easy process, but the difficulty is working out where to put my thumb.
The recording is cut into short overlapping slices, each slice is split into its frequencies with a Fourier transform, and everything is set to zero except a narrow band that follows the moan’s pitch as it slides down. The slices are then added back together into sound.4 With nothing masked, that round trip gives back the original recording exactly, so the moan itself is untouched and only what was around it has gone.
When I first denoised this moan in 2023, I used an image-based model to make the mask, treating the spectrogram as a picture. That was more complex than what is here, but more in line with my research at the time. Here I have used a simple fixed rule instead, and Claude has kindly written out all the detail in the footnote for anyone who wants it.
Health warning – the denoised version shows what I decided the call is. Anything quieter going on at the same time, a faint second call for instance, has gone with the noise. With a big whale appearing to make a big long sound, it’s less of an issue. But if you have got several birds tweeting at once, with lots of harmonics, it’s a lot harder, as I’ve been finding with birdsong (a series for another day). So the original is the evidence, and my denoised version is just an illustration.
Where the sound comes from
North Atlantic right whales are among the most endangered large whales. Only about 380 remain, and they have been listed as endangered in the United States since 1970 (NOAA Fisheries). The Gulf of St Lawrence is now one of their “emerging high-use habitats”, where many are seen from May to October (North Atlantic Right Whale Consortium, 2025 report card). Beginning in 2017, unusually many right whales died or were injured in Canada and the United States, most of them from entanglement or collisions with vessels.
Scientists in Canada and the United States ran a two-day experiment in the Gulf in July 2018. A Royal Canadian Air Force CP-140 Aurora patrol aircraft dropped 32 sonobuoys in a grid about 8 km apart, while a research ship, a NOAA survey aircraft and underwater robots worked in the same area (Dalhousie University).
A sonobuoy floats at the surface, hangs a hydrophone (an underwater microphone) below it, and sends what it hears back by radio. Having dropped them, the patrol aircraft stayed for the afternoon, flying back and forth over the buoys and recording their radio signals. These buoys carry a compass and can tell which direction a sound comes from (NOAA Fisheries). Listening like this, without sending any sound into the water, is called passive acoustic monitoring – there is no Sean Connery asking Vasily for “one ping only”.
The recordings, with the analysts’ annotations and the buoys’ GPS tracks, were later released for the DCLDE 2024 workshop (Detection, Classification, Localisation and Density Estimation of marine mammals, Rotterdam, June 2024). They have since been used to test automatic detection and localisation of right whale calls, for example by Gehrmann et al. (2026).
Why this particular moan?
The annotators who originally went through the data said this moan was heard by 24 of the 32 buoys, and so it seemed like a great one to use to help locate where the whale actually is. I used the sound from the buoy that heard the moan most clearly, which was not the nearest buoy but one about 8 km from where the whale turned out to be.5
Where AI comes in, and where it doesn’t
Not much here is machine learning. People originally found and labelled the moan by listening and looking at spectrograms. The denoising here is ordinary signal processing, a fixed rule with nothing learned from data. (My first attempt in 2023 did use a model.)
The AI is in how the post was made. I wrote the code that cuts the clip, measures the call, removes the noise and runs the player with an AI coding assistant (Claude), and Claude wrote the first draft of this text, which I then rewrote to make it a bit more me. One thing I am keen on is evidence and repeatability, so I hold Claude to a few rules, including that every number and every image comes from a script that can be run again.
Next
Sound travels through seawater at nearly 1.5 km per second,6 so the moan reached each of the 24 buoys at a slightly different time, and those differences say where the whale was. Or at least roughly where. Finding the whale is the next post in this series. Later ones follow the patrol aircraft, which can be heard on the buoys too, and that is how we know where it flew.
The data are the DCLDE 2024 right whale sonobuoy dataset, made available by Dalhousie University, Fisheries and Oceans Canada, Defence Research and Development Canada, the Acoustic Data Analysis Centre, the NOAA Northeast Fisheries Science Center, the New England Aquarium’s Anderson Cabot Center for Ocean Life and the Canadian Whale Institute. The recordings were made by the Royal Canadian Air Force.
References
Footnotes
The spectrogram uses 1,024-sample Hann windows (0.14 s, with frequency steps of about 7 Hz) overlapping by seven-eighths, with levels in decibels relative to the median of the clip, shown from 0 to 400 Hz. The recording has 7,350 samples per second. The audio is the buoy’s omnidirectional channel with a 20 Hz high-pass filter and its level normalised, and nothing else is done to it.↩︎
It starts at about 230 Hz around 2.3 seconds in, drops quickly to about 170 Hz, then glides down to about 120 Hz and stops just before eight seconds.↩︎
The dataset’s documentation (a report for the workshop by TNO, the Netherlands Organisation for Applied Scientific Research) lists these labels:
- upcall, gunshot, moan and scream for right whales
- blows of unknown species
- calls of other species.
The slices are 70 ms long, with a new one every 17 ms. The timing information in each slice (its phase) is left untouched. The moan is found automatically, as the frames where the strongest peak between 90 and 260 Hz stands more than 10 dB above that band’s median (after a quarter-second running median), here 2.2–7.8 s. The pitch track (sub-bin peaks, smoothed over half a second) runs from 218 Hz down to 121 Hz. The first few frames are faint, and the smoothing rounds off the quick first drop, so the track starts below the call itself. Frame by frame, the strongest peak stays at about 230 Hz from 2.3 to 2.7 s. The band is a Gaussian (standard deviation 12 Hz) around the track, faded in and out over 0.1 s at each end. No second harmonic stands out, so only the fundamental is kept. The denoised clip has the same gain as the original, so the moan is equally loud in both.↩︎
It was the clearest by signal-to-noise ratio, 16 dB against 7 dB on the nearest buoy, 1 km away. How loud a call sounds on a buoy depends on more than distance. Noise at the buoy, the water in between and the depth of the whale all play a part.↩︎
Textbooks give about 1.5 km/s for seawater, and underwater gliders in the experiment measured 1.5 km/s at the surface. Sound is slower in cold water, though, and in summer the Gulf has a cold layer about 50 m down, where the gliders measured about 1.445 km/s. The arrival times at the buoys fit that slower speed best, so 1.445 km/s is what we use to locate calls.↩︎